Inside Urbana’s Arrests Data: A Visual Narrative
Fall 2023 Final Project for IS 445: Data Visualization at UIUC
Group Members: Kavya Moharana, Sanjana Pai, Ridah Shaikh, Shreshika Bommana
The Dataset The Analysis (Jupyter Notebook)
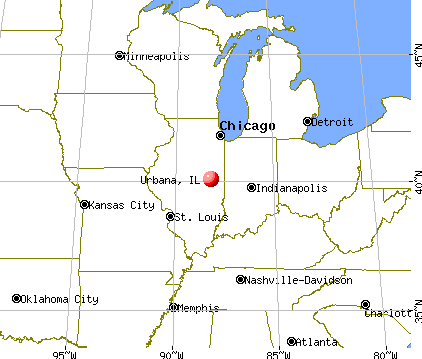
The University of Illinois Urbana-Champaign, as its name indicates, is located in both Urbana, Illinois and Champaign, Illinois. As a safety measure, students on campus tend to receive alert emails and/or text messages related to crimes occurring in the campus area in an effort to keep students informed about any possible safety concerns. As such, we thought it would be interesting to explore the arrest records of Urbana, which is generally considered the safer town of the campus. Our dataset contains all of the arrests made by the Urbana police since 1988. The dataset includes the demographics of each of the arrestees, including their age, race, employment status, arrest resolution, etc. The aforementioned variables were of particular interest to us. As the map above shows, Urbana is located in east-central Illinois.
Visualizing Average Age and Arrest Resolution alongside Employment Status
We have created a visualization that displays some of the important descriptors of those arrested in Urbana. Our graphs feature a dropdown menu allowing you to choose which year’s data will be shown, ranging from 1993 to 2019. Upon selecting a year, both the bar graph and the pie chart will update to display the information specific to that year. The bar graph on the left shows the average age of arrestees depending on the resolution of their arrest. These resolutions are whether the arrestee was bonded out (either individually or through another party), given a notice to appear in either municipal or state court, issued a “Promise to Comply,” or taken to jail. The pie chart on the right shows the distribution of the employment status for everyone who was arrested during the selected year. The statuses include employed, unemployed, full-time student, and military for certain years. Hovering over the graphs displays a tooltip that contains their specific information. The color of the bar graph was chosen to be maroon, since a red color scheme is typically associated with crime. The pie chart has similar color patterns as well. Explore the visualization below!
Select a year from 1993 to 2019
During our own exploration of the dataset, one of the interesting things we discovered was regarding the employment status of those arrested. During the earlier years, the majority of the arrestees had an employment status of employed. However, as the years progressed closer to present, the majority shifted to unemployed. This is a change would be fascinating to explore further.
Another variable we wanted to explore from our dataset was the race of the arrestees. However, we deemed it necessary to emphasize the complicated nature of discussing race in such datasets. Throughout the years, the definition of race has changed as it is a subjective categorization of people in a society. As such, it is important to preface our visualization with this information. The following infographic shows the composition of races and ethinicities in Urbana, Illinois by year from 2013 to 2021, allowing us to get a general sense of the distribution of races for our dataset.
Urbana, IL | Data USA. datausa.io/profile/geo/urbana-il#race_and_ethnicity. Accessed 1 Dec. 2023.
Based on this infographic, we can see that the race most dominant in the population of Urbana is white (non-Hispanic), with over 50% every year displayed. The distribution of Black or African American (non-Hispanic) and Asian (non-Hispanic) individuals tended to be between 16% and 20% each.
Taking a closer look at the race distribution for our dataset, we noticed that the arrestees were predominantly Black or white. These races account for about 41.8% and 49.9% of the people arrested, respectively. The breakdown of races displays a majority-white population in Urbana with Black people and Asian people making up a third of the population combined. These are important contextual statistics to consider when analyzing arrestee data.
Arrests in Urbana by Race:
The arrest data for Urbana, Illinois reveals several interesting trends over time. The employment status of arrestees has shifted from predominantly employed to unemployed in recent years. Additionally, the age distribution of arrestees has shifted towards younger individuals. This data highlights the need for further exploration of the factors contributing to these trends.