Analyzing Popular Movies & TV Shows on Netflix and Prime Video
Final project for STAT 207: Data Science Exploration at UIUC
Languages and Tools Used





Motivation behind the Analysis:
The main motivation behind exploring this dataset would be the popularity and widespread use of Netflix and Amazon Prime Video as the top 2 streaming platforms for movies and television. I enjoy using these platforms for binging TV shows or movies and believe that analyzing such data would be helpful to us and others with similar hobbies. Ultimately the goal is to determine if either streaming platform contained certain movies or shows with higher ratings and if the ratings differ based on genre or year of release.
Research Questions:
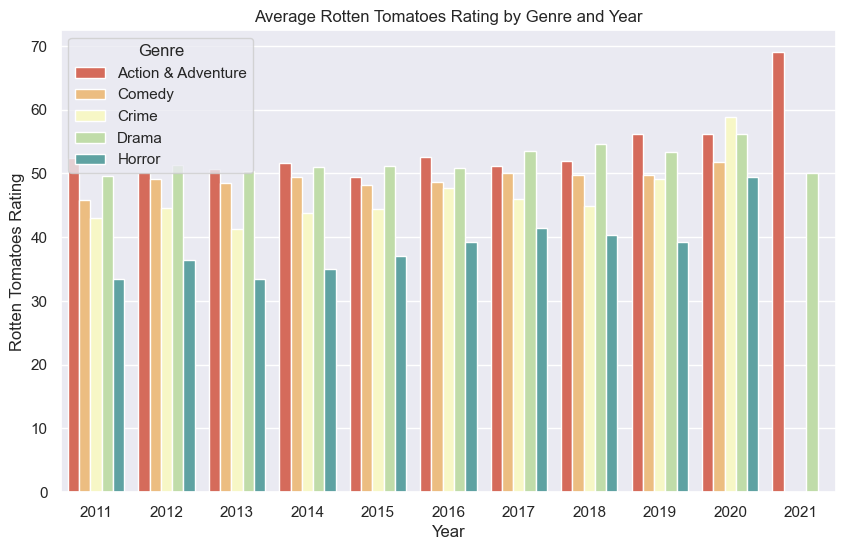
- How does the relationship between genre and the year it came out affect the overall Rotten Tomatoes rating of the movie?
- Is there an association between Action and Adventure titles and higher rated Rotten Tomato scores from the population of popular movies and tv shows on Netflix and Amazon Prime Video?
- Is there a linear relationship between the Rotten Tomatoes rating of a movie and the year it was released, the age rating, and whether the movie is on Netflix or Amazon Prime Video?
- Can we predict whether a movie is available on Netflix based on its age rating, genre, Rotten Tomatoes score, and IMDb rating?
Details & Limitations of the Dataset:
This dataset is from Kaggle and presents a collection of popular movies and TV shows on both Netflix and Amazon Prime Video. The dataframe contains 10 columns and 24664 rows before cleaning for missing values and other factors. The data includes titles from 1912 all the way to 2021 but we will be focusing in on the programs from the most recent decade of 2011 to 2021. There are some limitations to the data as it does not include any variables which allow for us to differentiate between TV shows and movies in the dataset. Therefore, we have chosen to look at both of these forms of media hollistically instead of differentiating between the two.
Descriptive Analytics
Version 1 - Matplotlib/Seaborn Bar Plot
 Version 2 - Interactive Vega-Lite Bar Plot (Scores Combined)
Version 3 - Interactive Vega-Lite Scatter Plot
Inference
Visualizing the top 25% of Rotten Tomatoes scores for the Titles
Logistic Regression
Predicting whether a movie is available on Netflix based on its age rating, genre, Rotten Tomatoes score, and IMDb rating
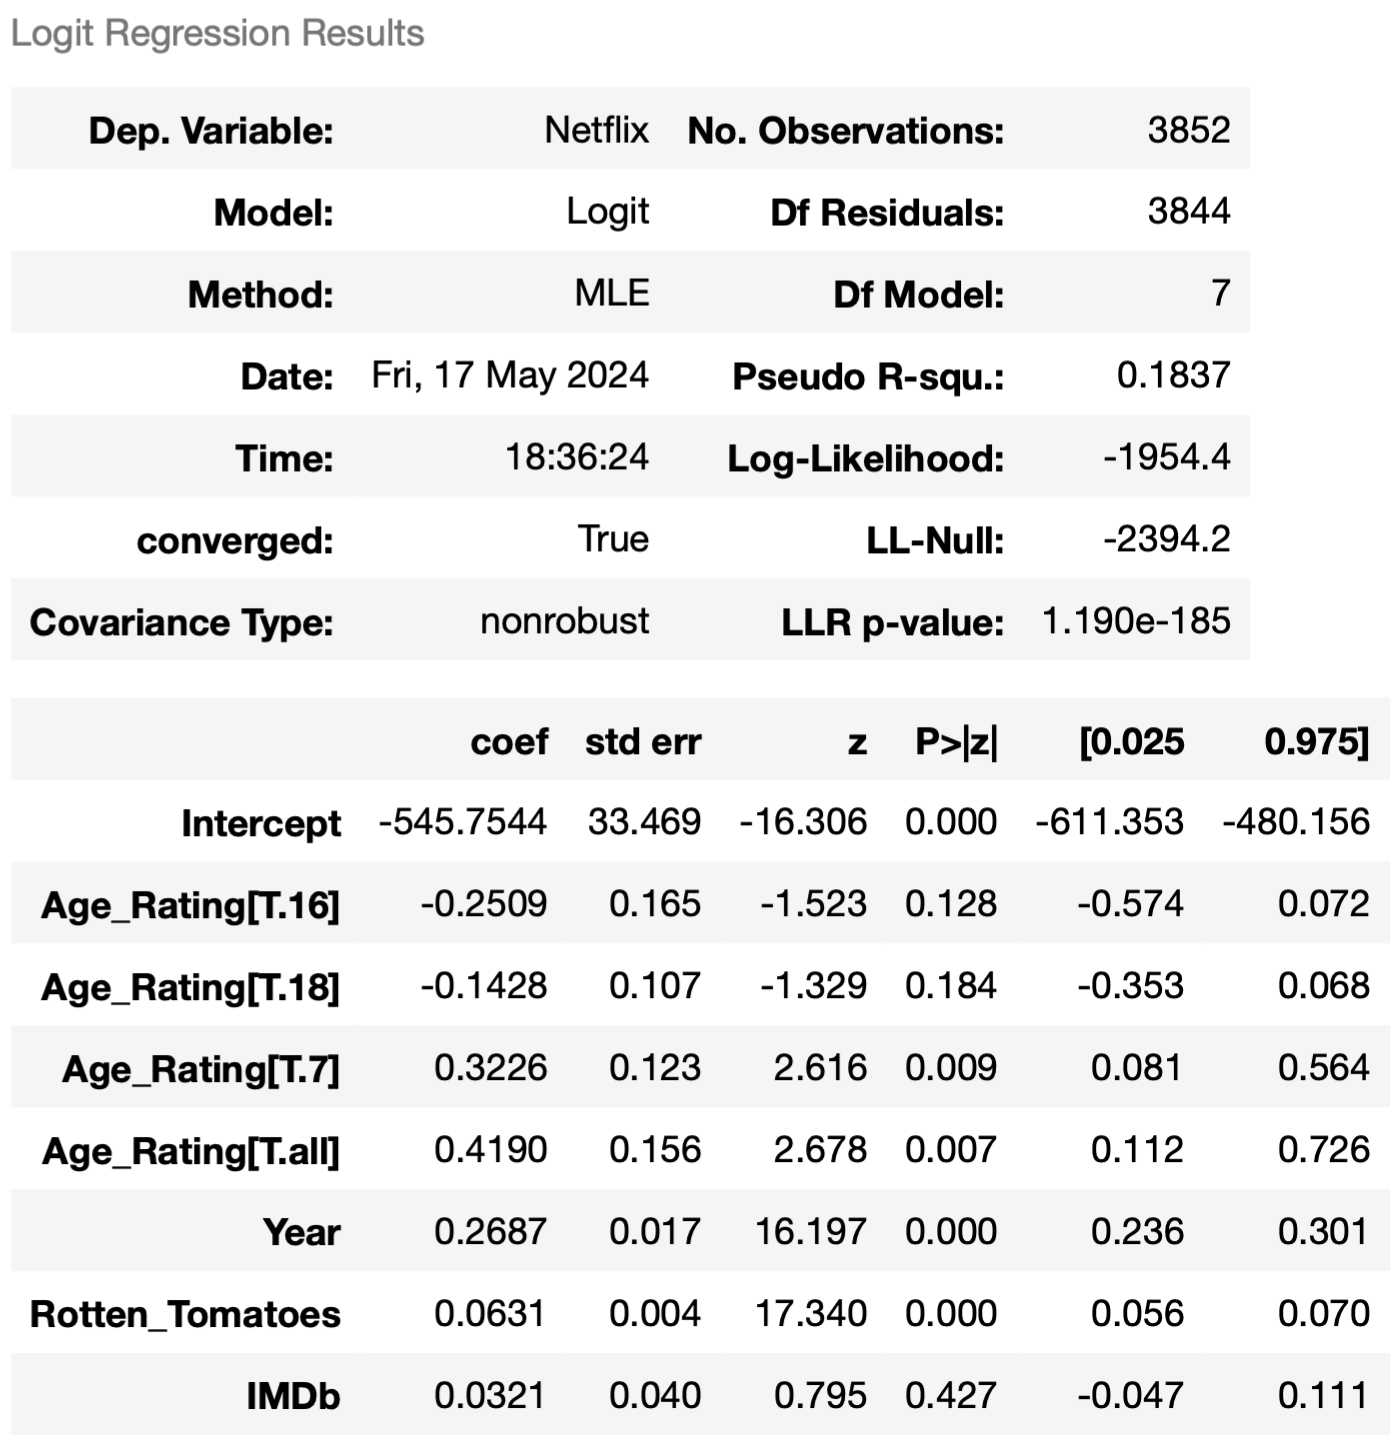
- The pseudo R-squared value of 0.1837 shows that the final logistic regression model had a statistically significant relationship with whether a movie is available on Netflix or not. This means that the model explains about 18% of the variability in the response variable.
- We also found that the age rating, year of release, Rotten Tomatoes score, and IMDb rating were significant predictors of whether a movie is available on Netflix or not. Specifically, movies with higher age ratings and higher Rotten Tomatoes and IMDb scores were more likely to be available on Netflix.
- The AUC of 0.7724 indicated that the model has some ability to distinguish between positive and negative cases, although there is still room for improvement. Choosing an appropriate threshold of 0.2, we prioritized correctly predicting positive cases (i.e., movies that are on Netflix).
- Shows that we can use the model to identify movies that are likely to be available on Netflix within a reasonable degree of accuracy
Analysis Summary
- There may be an association between the genre of a movie, year of release and the Rotten Tomatoes score, with Action & Adventure and Drama consistently having higher scores and the median score by year increasing steadily from 2011 to 2021.
- We analyzed the concentration of Action and Adventure movies’ Rotten Tomatoes scores, and the confidence intervals provided more information about the possible association between genre and Rotten Tomatoes score.
- We gained insight into the lack of a linear relationship between the year, rating, and streaming platform of movies.
- Age rating, year of release, Rotten Tomatoes score, and IMDb rating were significant predictors of Netflix availability.
- The ROC curve and AUC with a threshold of 0.2 suggested that the model can identify movies available on Netflix with a reasonable degree of accuracy, providing insights for content targeting by producers and distributors.