Analyzing Spotify’s Hit Songs and How Genres Encapsulate Different Music Trends
Final projects for STAT 107: Data Science Discovery and IS 204: Research Design for Information Sciences at UIUC
Languages and Tools Used




Exploring the Spotify Top 100 Hit Songs 2010 to 2022 Dataset
The second project uses another Kaggle dataset for Spotify’s top 100 hit songs per year from 2010 to 2022. This data was extracted directly from the Spotify API and specifically their ‘Top Hits’ playlist for each year (with 100 songs per year). The dataset has 23 columns and 2400 rows with 13 track audio features consisting of danceability, energy, key, loudness, mode, speechiness, acousticness, instrumentalness, liveness, valence, tempo, duration, and time signature.
Research Questions:
- Why are specific music trends on Spotify the way they are?
- What aspects contribute to trends within a user’s music and listening history?
- How does a user most frequently discover their most listened to genre?
- Is someone who is interested in one genre more likely to be interested in another genre?
Analysis Results:
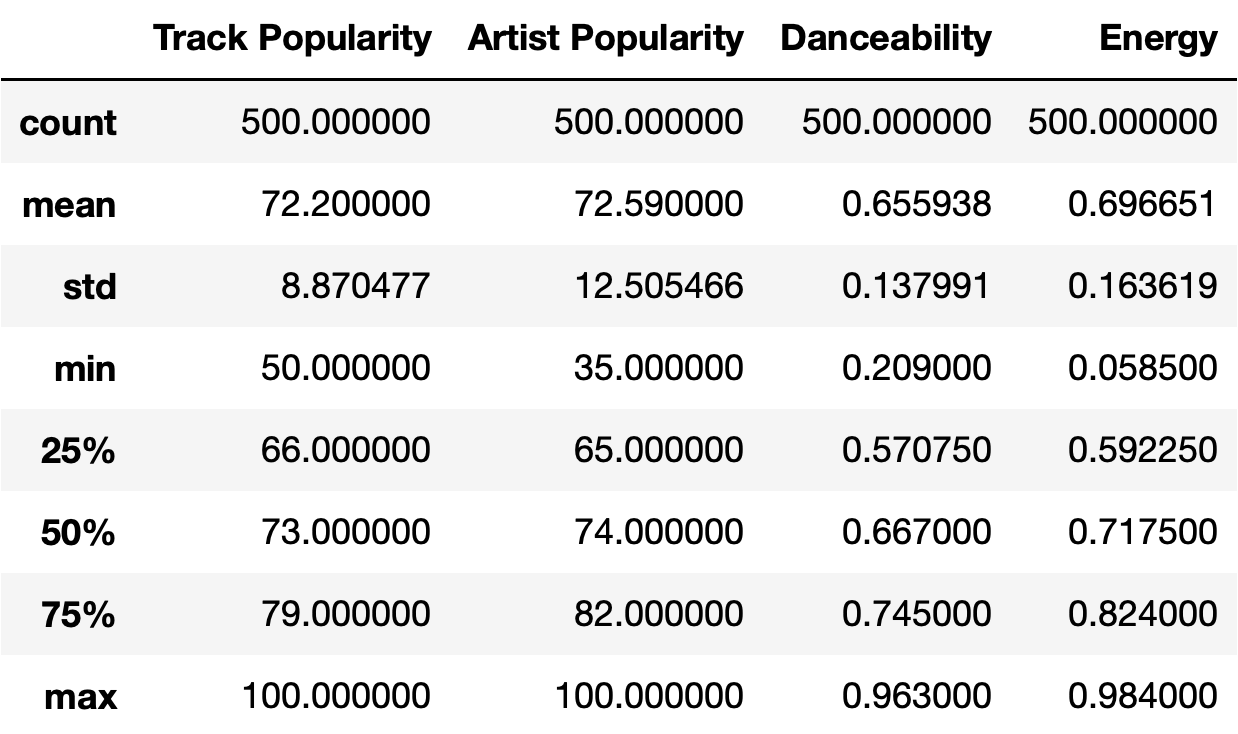 Table 1 – Summary Statistics
Figure 1.1 – Exploratory Quantitative Analysis on Popularity Factors
- weak positive correlation for first chart shows that music trends are multifaceted
- energy variable contributes to more trends than expected
Figure 1.2 – Exploratory Quantitative Analysis on Average Duration of Songs
- strong negative trend display how song duration has decreased significantly since 2014
- future music releases may continue to decrease in duration or remain stagnant
Figure 2 – Linear Regression Analysis of Artist Popularity and Track Popularity
- strong positive correlation implies artist popularity is closely tied to the popularity of a song and how a user finds hit songs
Figure 3 – Correlation between Popular Genres
- The rap genre has moderate positive correlation with hip-hop and trap genres
- Users who like broad genres like rap or pop are may be more likely to be interested in closely related genres like trap